SMU-Unit-3-Final
Brian Tobin
September 10, 2019
R Markdown
library(tidyr)
library(ggplot2)
library(dplyr)
library(GGally)
FALSE Registered S3 method overwritten by 'GGally':
FALSE method from
FALSE +.gg ggplot2FALSE
FALSE Attaching package: 'GGally'FALSE The following object is masked from 'package:dplyr':
FALSE
FALSE nasasummary(diamonds)
head(diamonds)
str(diamonds)
diamonds %>%
summarise(mean = mean(price), sd = sd(price), median = median(price))
diamonds %>%
group_by(cut) %>%
summarise(counts = n())
ggplot(data = diamonds, aes(x = cut)) +
geom_bar()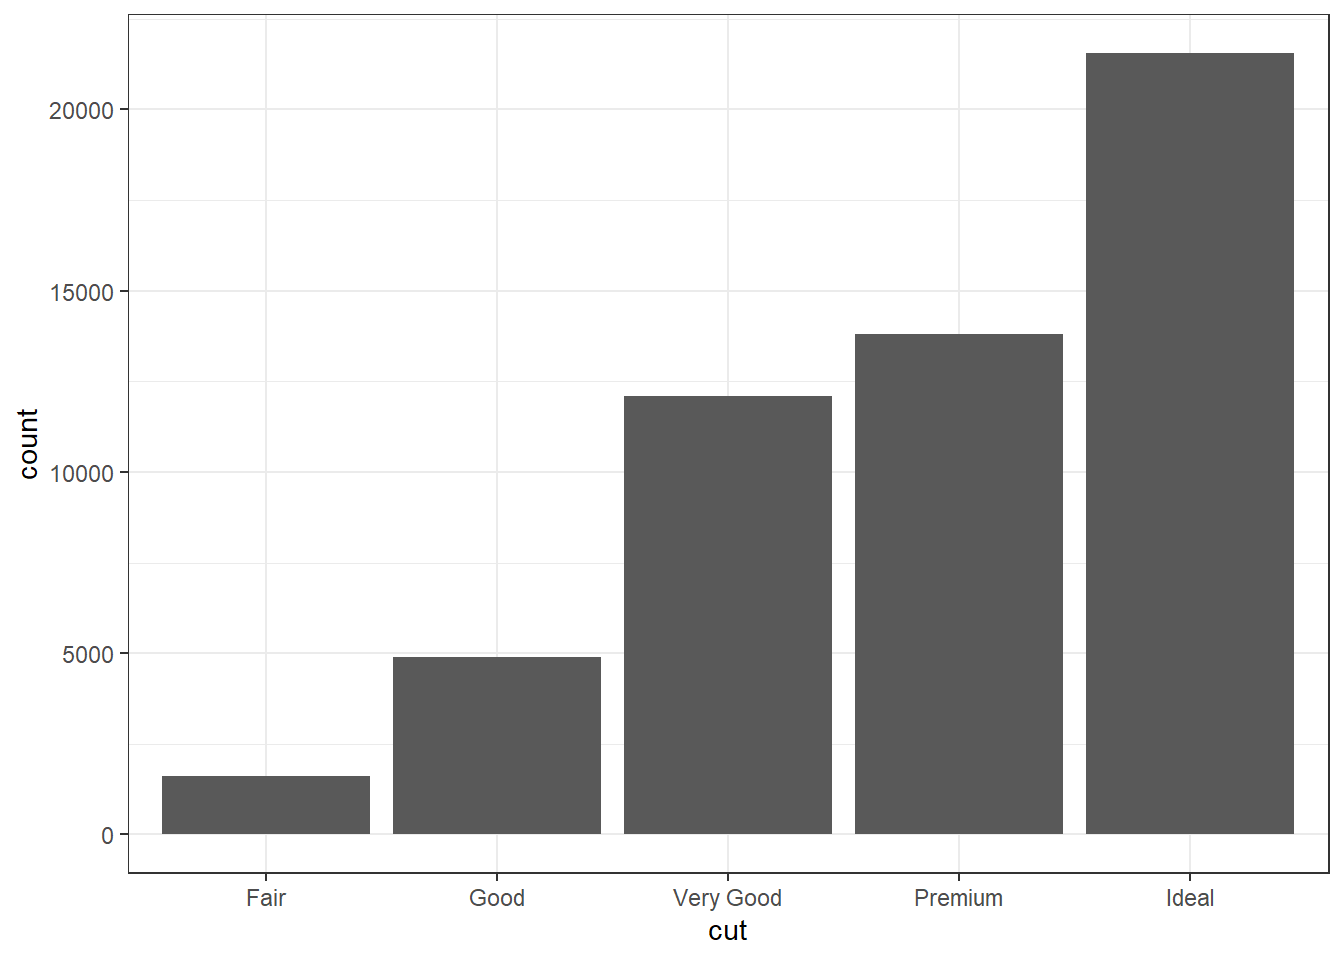
ggplot(data = diamonds, aes(x = price,fill=cut)) +
  geom_bar()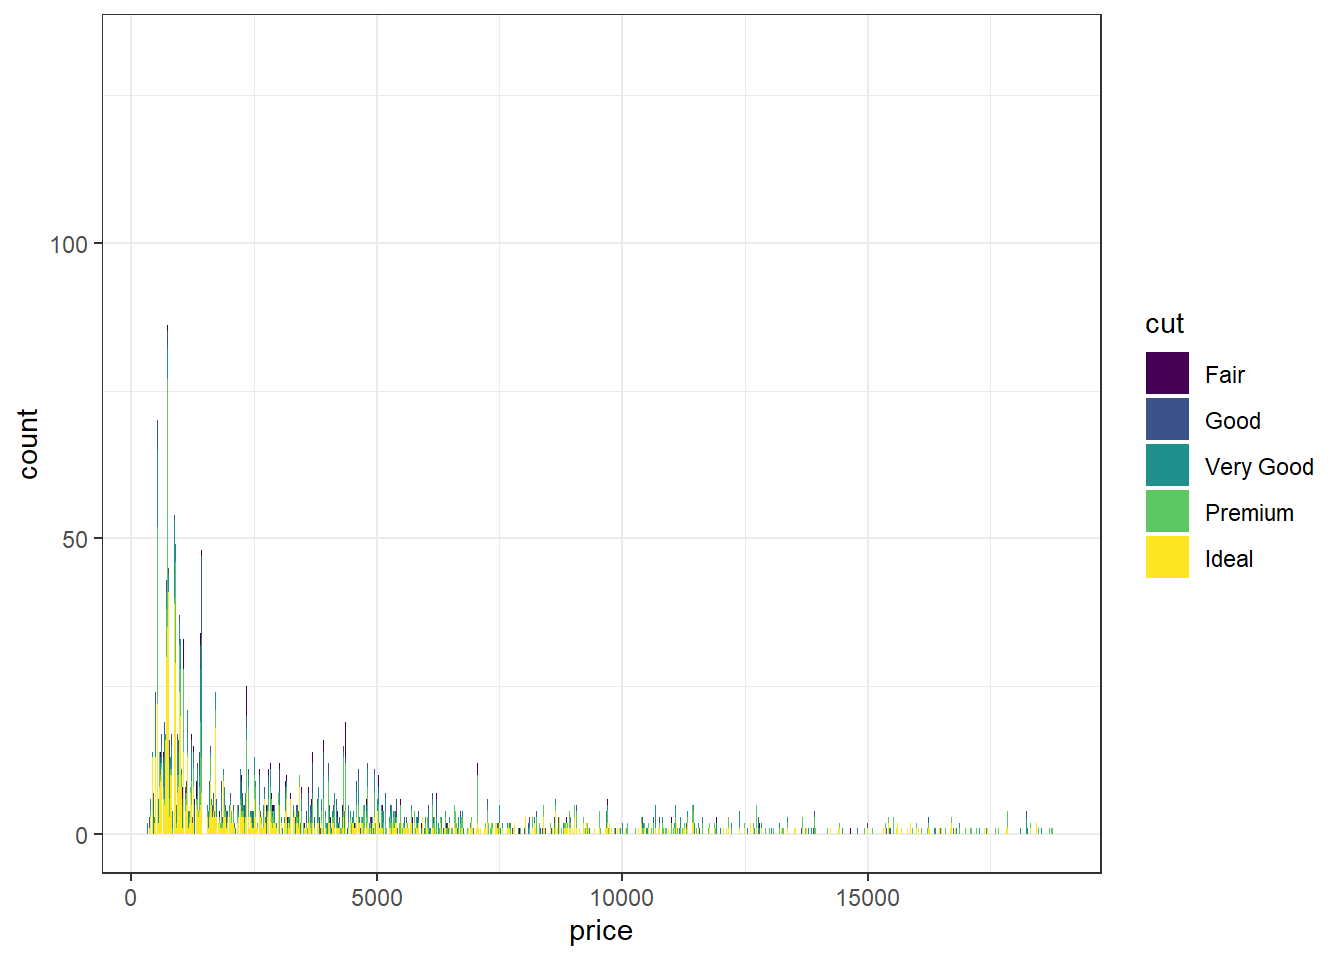
ggplot(data = diamonds, aes(x = carat,fill=price)) +
  geom_bar()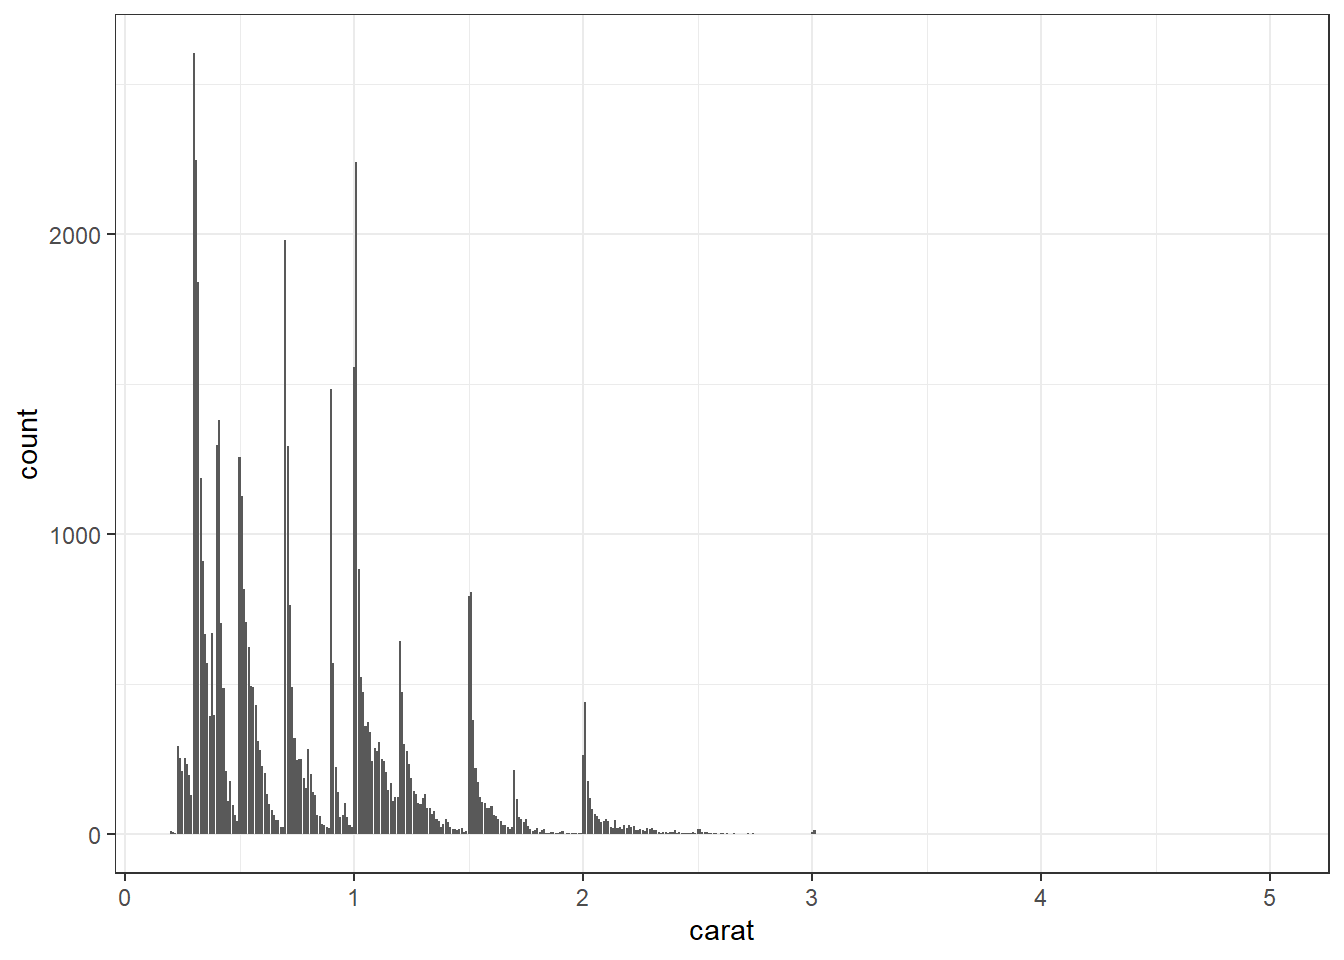
ggplot(diamonds, aes(factor(color), (price/carat), fill=color)) +
  geom_boxplot() +
  ggtitle("Diamond Price per Carat according Color") +
  xlab("Color") + ylab("Diamond Price per Carat U$") +
  coord_cartesian(ylim=c(0,10000))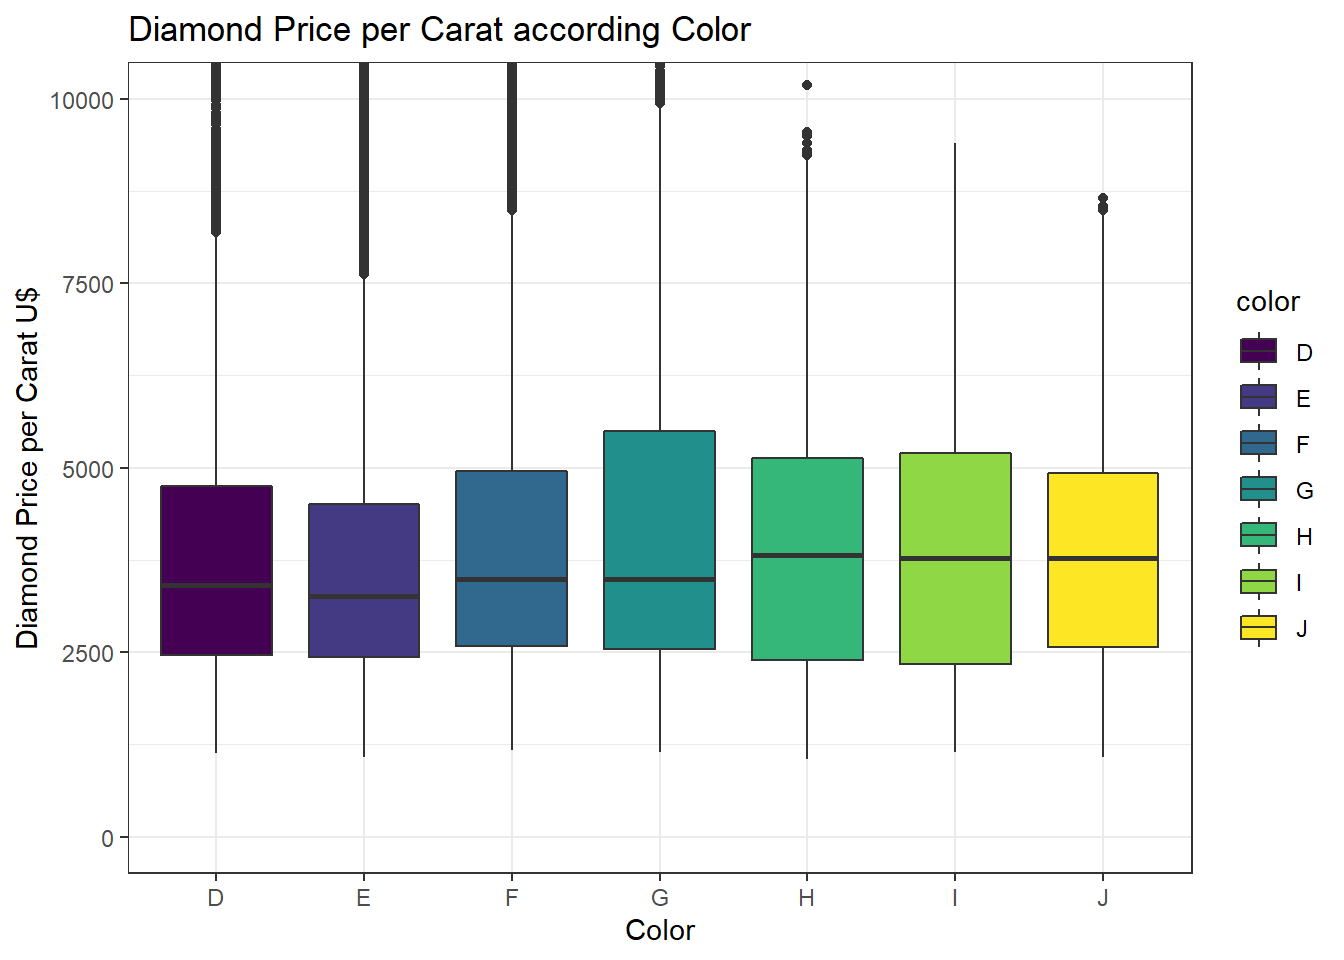
diamonds %>%
mutate(priceFact = cut(price, breaks = c(0,2000,10000,15000, 19000), labels = c("Fair","Good", "Very Good", "Premium"))) %>%
ggplot(aes(x = carat, fill = priceFact)) +
geom_histogram() + ylim(c(0,200)) +
facet_wrap(vars(priceFact))
FALSE `stat_bin()` using `bins = 30`. Pick better value with `binwidth`.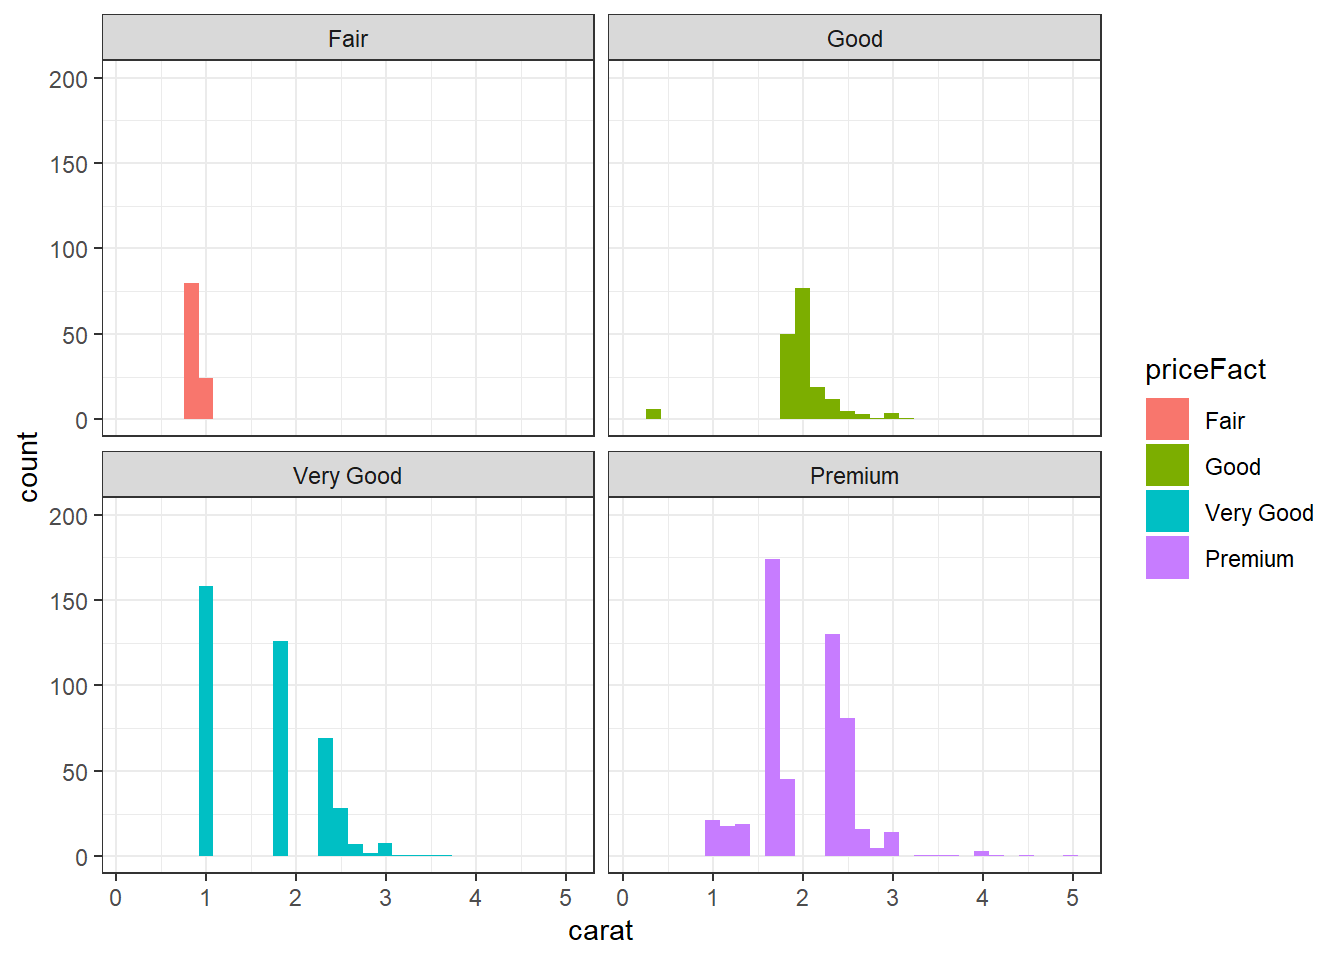
library(plotly)FALSE
FALSE Attaching package: 'plotly'FALSE The following object is masked from 'package:ggplot2':
FALSE
FALSE last_plotFALSE The following object is masked from 'package:stats':
FALSE
FALSE filterFALSE The following object is masked from 'package:graphics':
FALSE
FALSE layoutp = diamonds %>%
count(color,cut) %>%
ggplot(aes(x = color, y = cut)) +
geom_tile(mapping = aes(fill = n))
ggplotly(p)
diamonds %>%
ggplot(aes(x = price, y = carat)) +
geom_boxplot(mapping = aes(group = cut_width(price,150)))+
xlim(c(0,12000))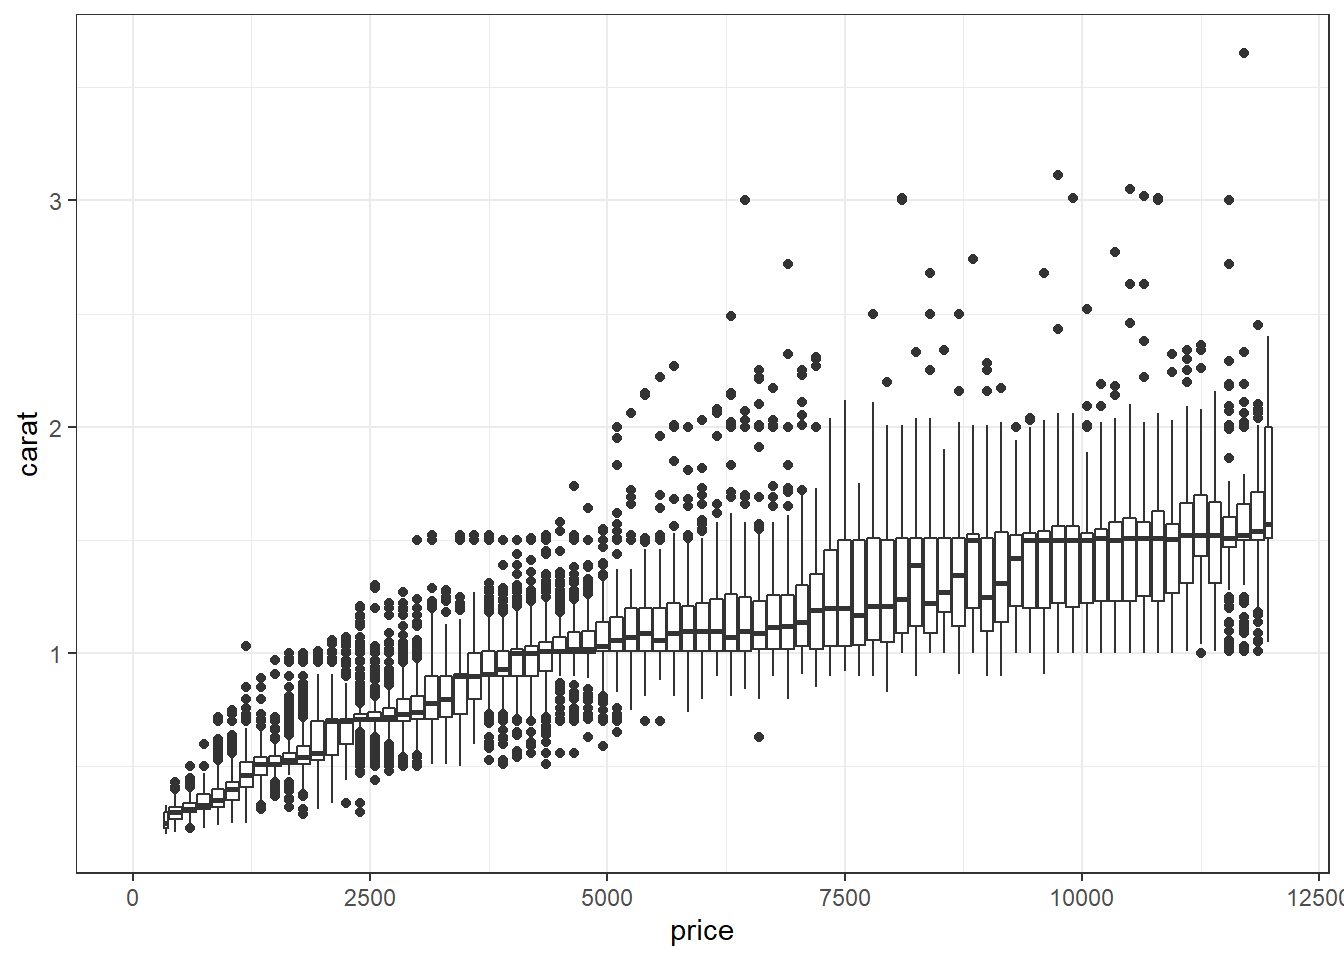
diamonds %>%
ggplot(aes(x = price, y = color)) +
geom_boxplot(mapping = aes(group = cut_width(price,150)))+
xlim(c(0,12000))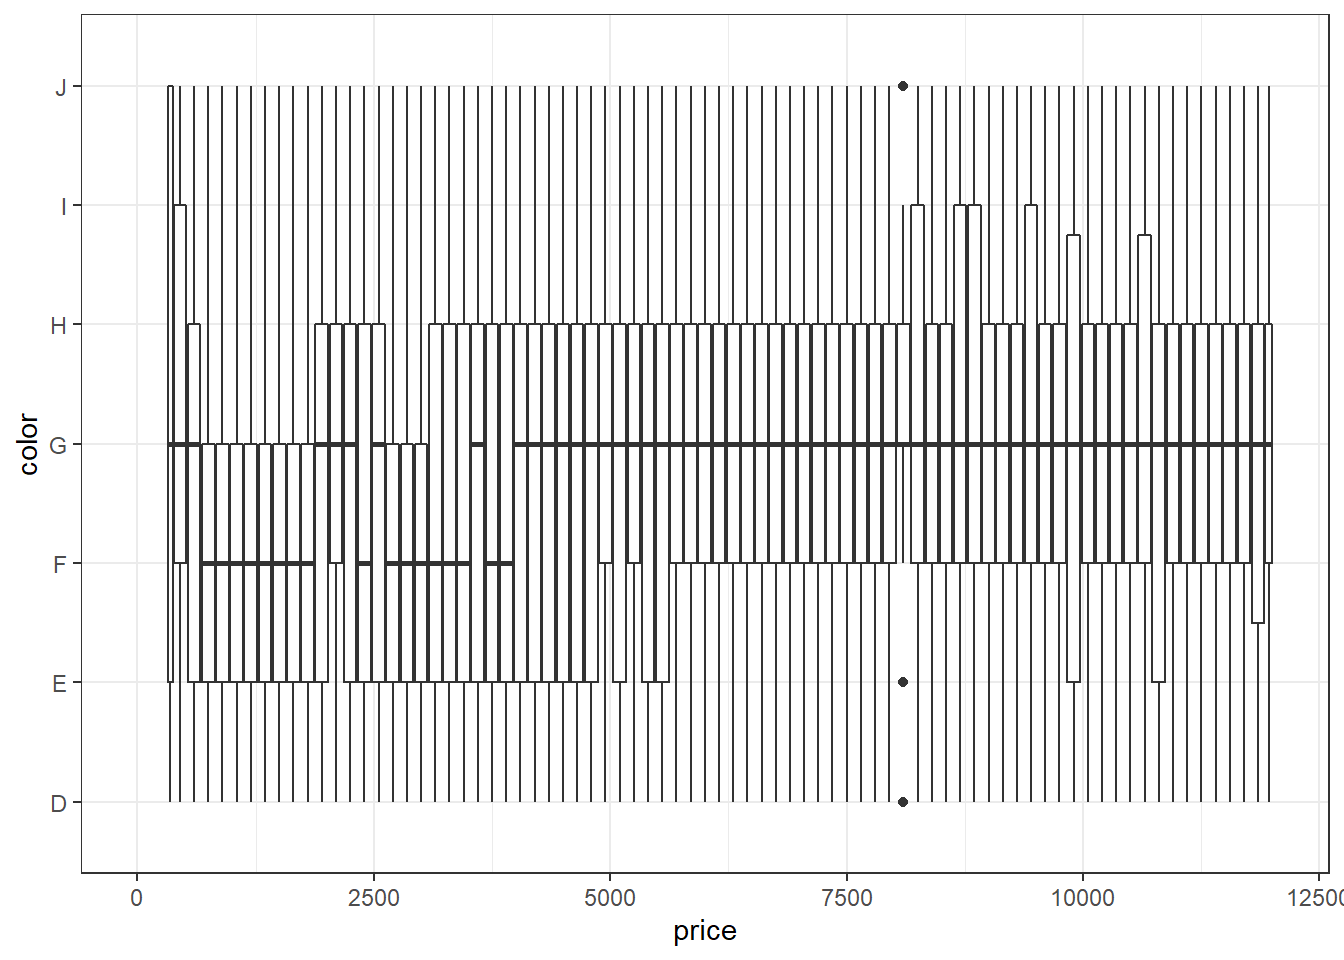
diamonds %>%
ggplot(aes(x = price, y = clarity)) +
geom_boxplot(mapping = aes(group = cut_width(price,150)))+
xlim(c(0,12000))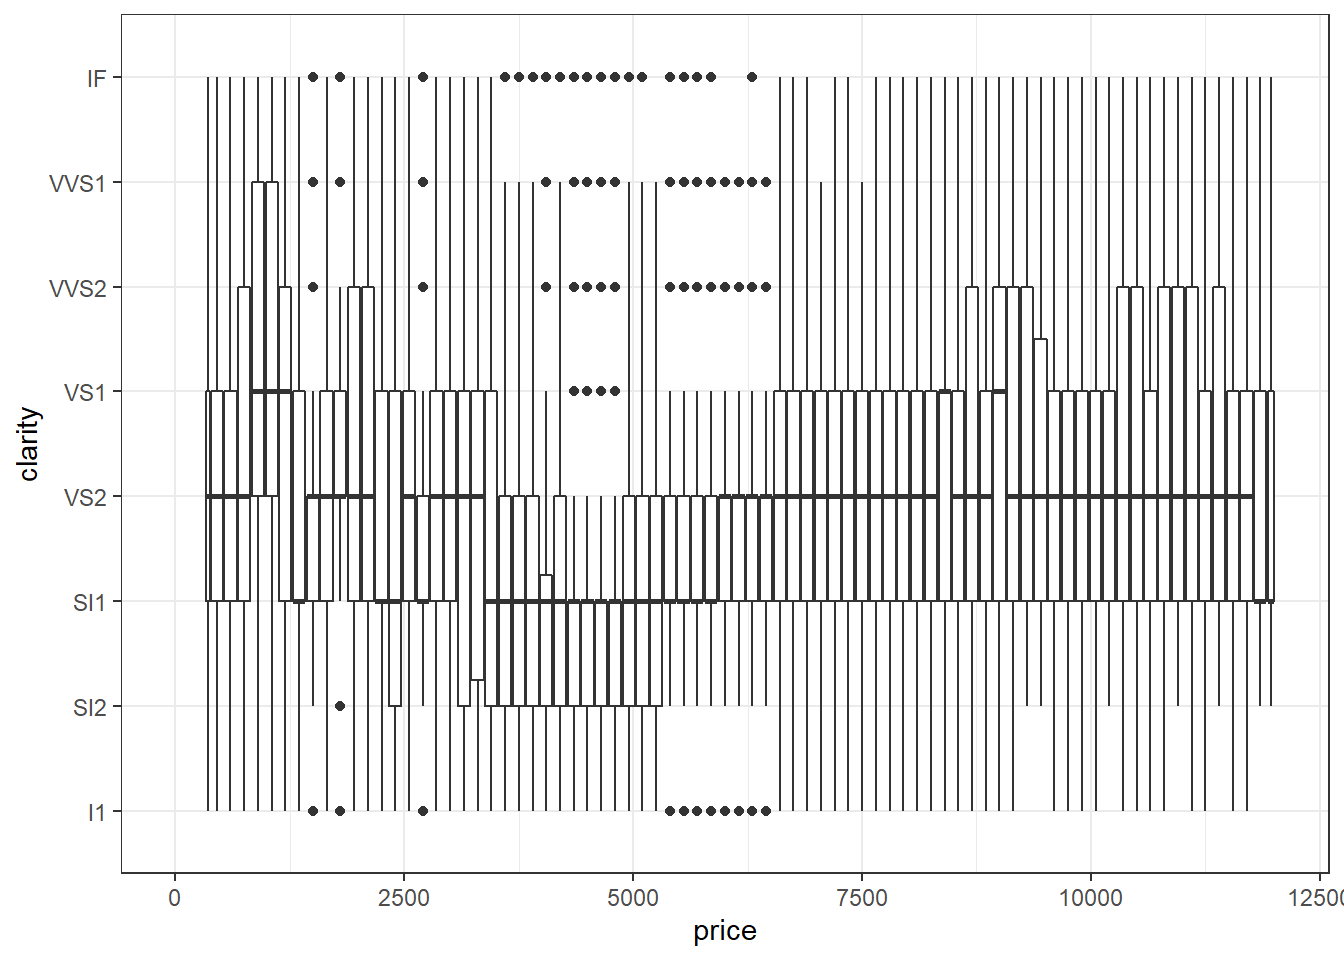
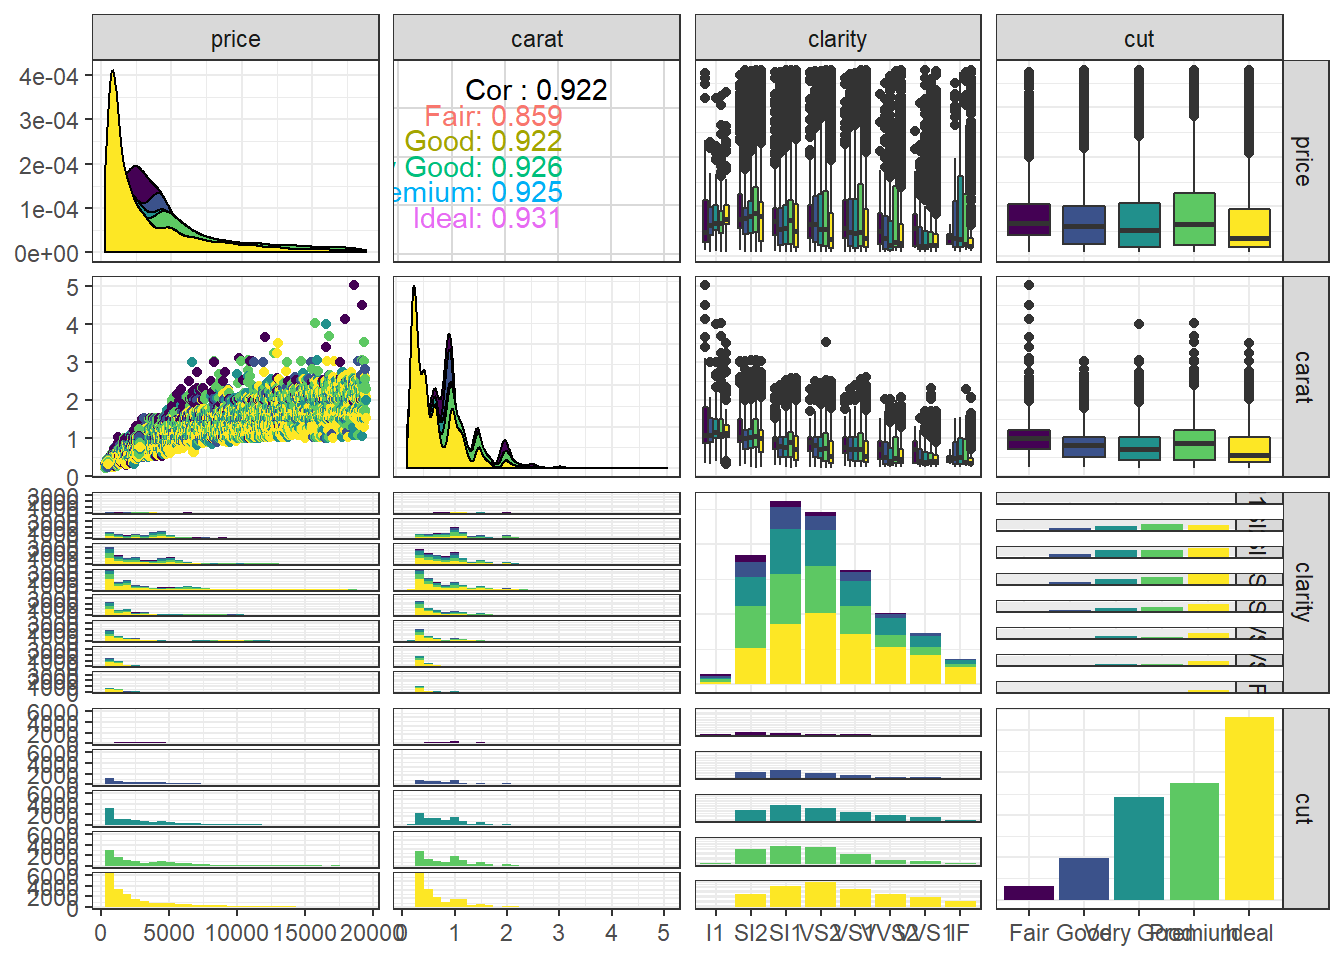
diamonds %>%
select(price, carat, clarity,cut) %>%
ggpairs(aes(color = cut))
FALSE ```
FALSE plot: [1,1] [=====>——————————————————————————————-] 6% est: 0s plot: [1,2] [===========>————————————————————————————-] 12% est: 4s plot: [1,3] [=================>——————————————————————————-] 19% est: 3s plot: [1,4] [=======================>————————————————————————-] 25% est: 5s plot: [2,1] [=============================>——————————————————————-] 31% est: 5s plot: [2,2] [===================================>————————————————————-] 38% est: 5s plot: [2,3] [=========================================>——————————————————-] 44% est: 4s plot: [2,4] [===============================================>————————————————-] 50% est: 4s plot: [3,1] [======================================================>——————————————] 56% est: 3s stat_bin() using bins = 30. Pick better value with binwidth. FALSE plot: [3,2] [============================================================>————————————] 62% est: 3s stat_bin() using bins = 30. Pick better value with binwidth. FALSE plot: [3,3] [==================================================================>——————————] 69% est: 3s plot: [3,4] [========================================================================>————————] 75% est: 2s plot: [4,1] [==============================================================================>——————] 81% est: 2s stat_bin() using bins = 30. Pick better value with binwidth. FALSE plot: [4,2] [====================================================================================>————] 88% est: 1s stat_bin() using bins = 30. Pick better value with binwidth. FALSE plot: [4,3] [==========================================================================================>——] 94% est: 1s plot: [4,4] [=================================================================================================]100% est: 0s
```
ggplot(diamonds, aes(cut, color)) +
  geom_jitter(aes(color = cut), size = 0.5)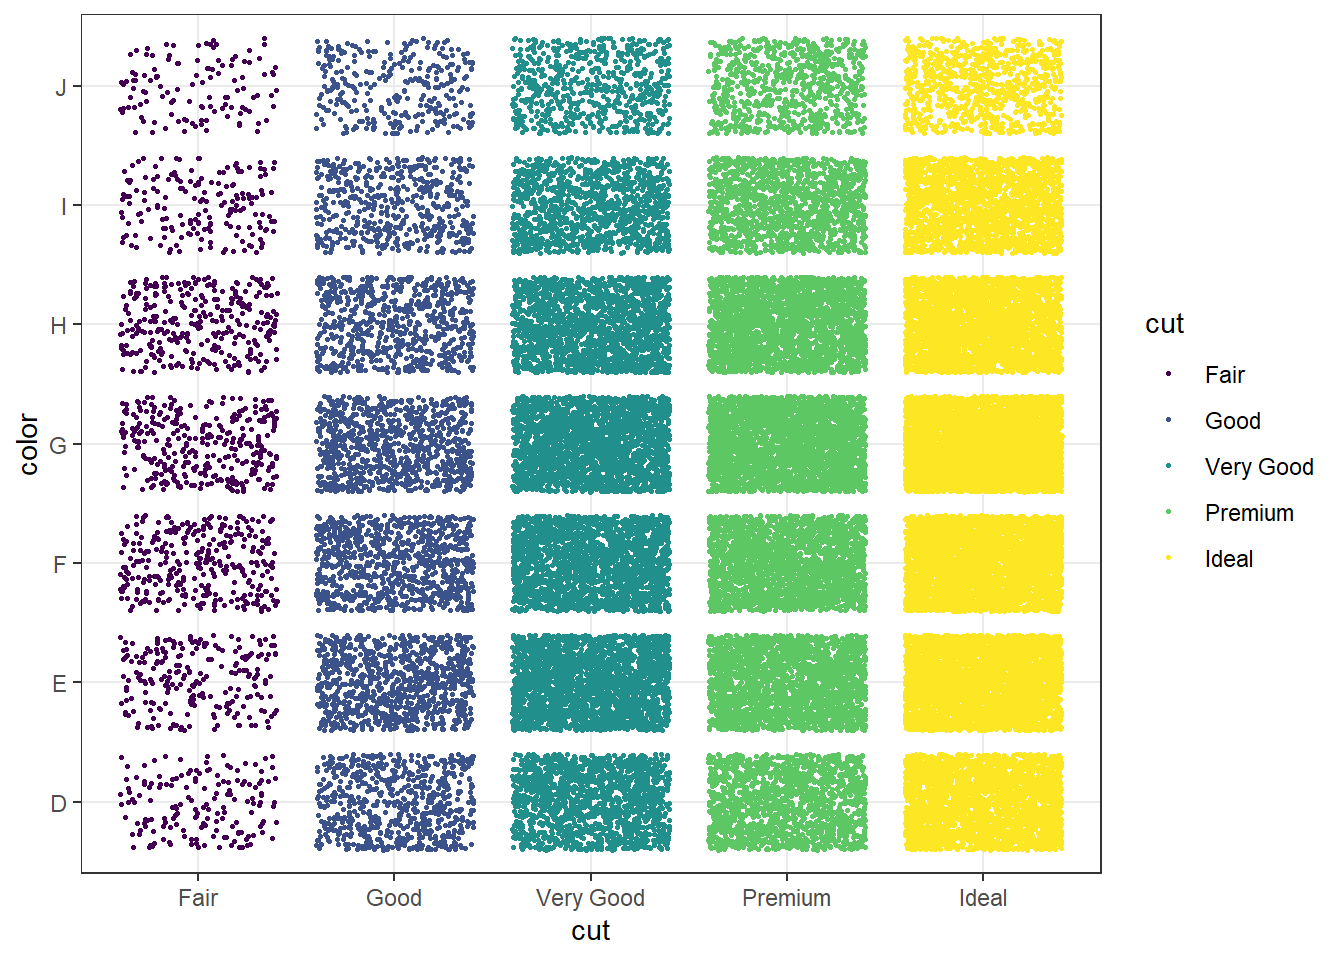
library(ggridges)FALSE
FALSE Attaching package: 'ggridges'
FALSE
FALSE The following object is masked from 'package:ggplot2':
FALSE
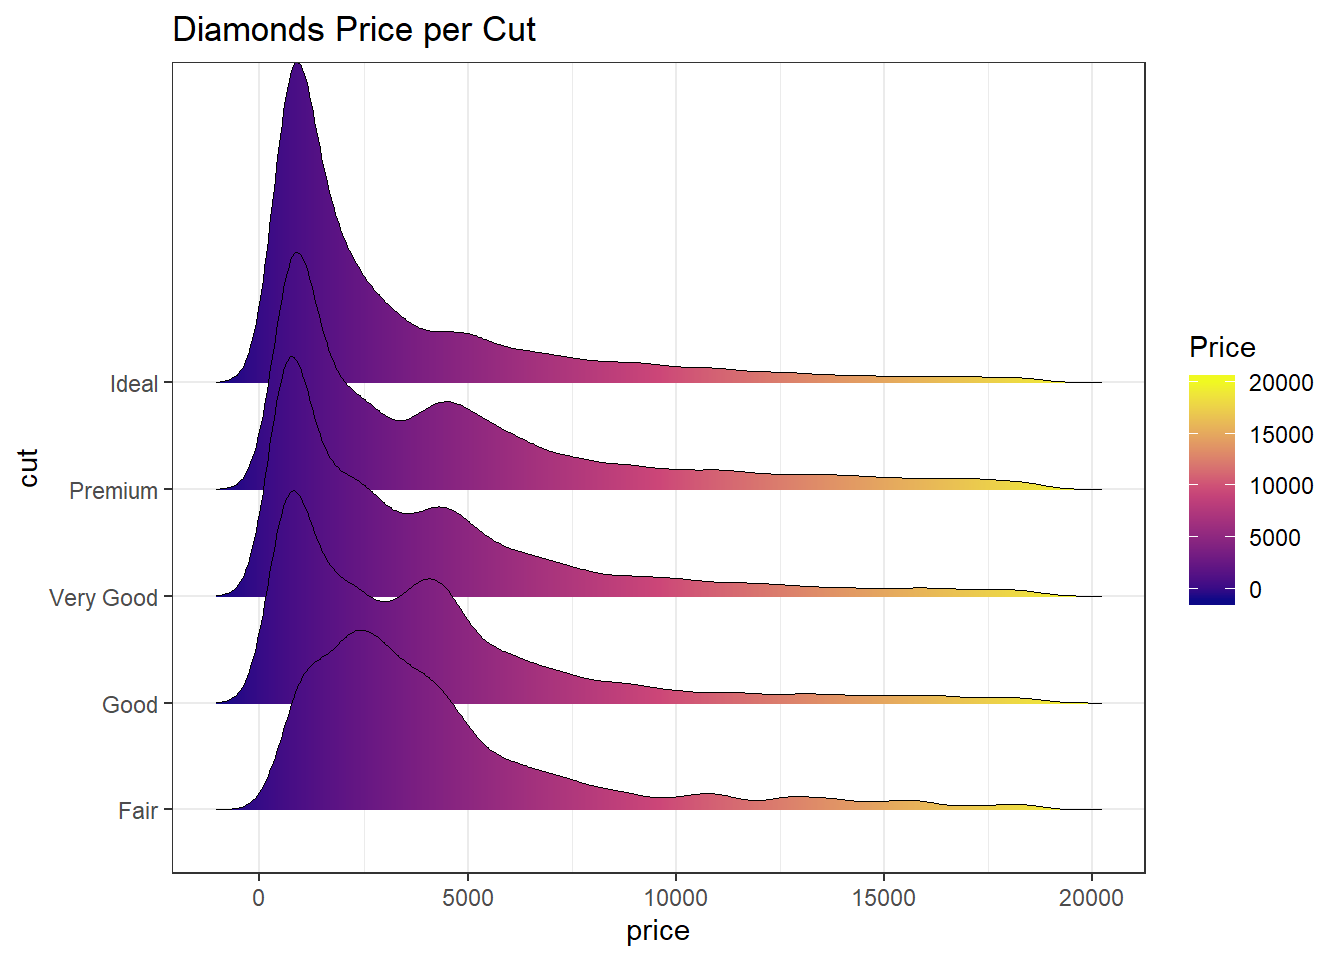
FALSE scale_discrete_manualggplot(
diamonds,
aes(x = price, y =cut)
) +
geom_density_ridges_gradient(
aes(fill = ..x..), scale = 3, size = 0.3
) +
scale_fill_gradientn(
colours = c("#0D0887FF", "#CC4678FF", "#F0F921FF"),
name = "Price"
)+
labs(title = 'Diamonds Price per Cut')FALSE Picking joint bandwidth of 458